Profiling on Windows: a Short Rant
on C++
We have to disrupt our scheduled program because I ran into an annoying hurdle and I feel we need to talk about it. Because right now the profiler situation on Windows kind of sucks and it’s an issue given how ubiquitous the platform is. It works alright for basic/medium usage, but when you need more advanced metrics it breaks down. Let me explain.
I have published many talks about performance, and in particular I had one about profiling and one about caches. CPU caches have been critical for performance for the past decade and a half and while sometimes you can ensure good cache hit rate by following existing patterns, sometimes you just need to measure.
There’s a host of solutions when it comes to sampling and instrumentation profiling on Windows. I always keep Optick around (even though I worry the project looks abandoned these days, I tried to reach out to the maintainer but he didn’t get back to me). There’s one that comes free with Visual Studio. I heard good things from Tracy but sadly I cannot get past the imgui feel of the interface. And if you feel like expensing some paid solution, I found Superluminal’s user experience quite good in the past.
But when you suspect you have a micro-architecture related issue, you need more metrics. Especially cache miss/hit rate, cycles per instruction, branch misspredicts, frontend/backend bound ops, that kind of thing. I recently ran into an issue that I couldn’t explain with basic flamegraphs and cpu time metrics. I suspect it’s related to some code that’s bad for hardware, maybe false sharing or cache-unfriendly memory access, but I cannot measure it.
On Linux and friends there’s a few options for this. Most commonly perf and Cachegrind are free and readily available.
But on Windows, there’s mostly one very obvious choice if you’re using an Intel CPU.. I even mention it in my talks. And it’s the reason I’m writing the article. It’s vTune.

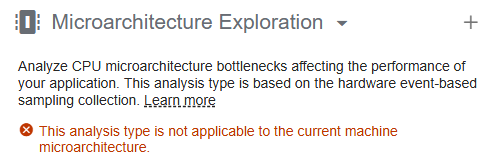
That’s right, Intel has decided that the major tool for CPU metrics on Windows now requires an 11th gen CPU or more recent. This wouldn’t be such an issue if you could rollback versions, but sadly, you can’t. Older releases are only available through paid support, and even then only for 2 years. For years every release of vTune only required a 5th gen Core, but if like me you hit the “update” button it will brick your profiler with no way back.
Why is it so bad? Well, I got a 10th gen CPU. Sure it’s over 5 years old, but it works just fine. It’s still the recommended spec for recent AAA games like Battlefield 6. Steam hardware survey does not have CPU model data, but we can use AVX512-VNNI instruction set support as a proxy (it was introduced with 10th gen) and that’s only 25% of all users at the time of writing.
Shouldn’t developers have beefier machines you may ask? Maybe. I considered getting a new laptop when I started my consulting business but so far I haven’t felt the need to change my workstation. And now that RAM prices have tripled and that GPUs are becoming a luxury I’m even less in a rush. I heard from fellow engineers with full-time positions that their request for upgrades are being delayed because their IT department cannot source components at reasonable prices either.
What’s the alternative? That’s the catch, I found nothing great so far. AMD has a similar toolhttps://www.amd.com/en/developer/uprof.html, but like Intel it only works for their CPUs, and as we mentioned this isn’t a great time to buy a new machine. I read that Perfview can collect hardware metrics but so far I found the interface too arcane to be used.
It’s a bit of a sad conclusion to say that I do not have a solution so far. If you happen to have kept a copy of the pre 2025 vTune offline installer, I suggest you hold on to it for dear life (and maybe host it somewhere and throw me a link 😎). And if you work at Intel, consider convincing the PM to bring back support for older CPUs (or at least make the old installers available). There’s a lot of software on Windows that could use better performance, and I don’t think cutting off a sizeable part of the user base from their profiling tool is a great way to improve the situation.