We Should Use Instrumented Profiling Scopes More
on C++, Game development
I have made an entire talk about profiling. Still, I keep running across projects that don’t use profilers much or at all. Or even more commonly, they do use profilers but do not know they can enrich their projects with profiler markers that would make captures more valuable and much easier to parse. Let’s fix that!
Two and a half profiler types
There’s many profilers out there, often split based on which form of profiling capture they rely upon:
- Sampling, which periodically pauses the program, records the stack trace of every threads, then continues. By doing this often enough (at least 1kHz, preferably more), we can build a breakdown of where on average does our capture spends CPU time. This is the default capture mode when using Instruments, vTune, Superluminal, Visual Studio or VerySleepy).
- Instrumented, where the program itself records time slices when markers are invoked. This requires code hooked up to the profiler to be added in the project and only markers present when the project was compiled will be visible, nothing else. This is the default capture of profilers included in game engines such as Unity or Unreal, as well most “game-oriented” profilers like Optick, Tracy and PIX.
Ideally you want a profiler that can do both at the same time, and well. Which usually means using the ones who are built for instrumentation first and then added sampling on top1. The idea being, they will display an instrumentation-driven flame chart, on which you can click on any individual marker to get a sampling frame graph2 of all the stacks that fell under it.
What you get in an capture
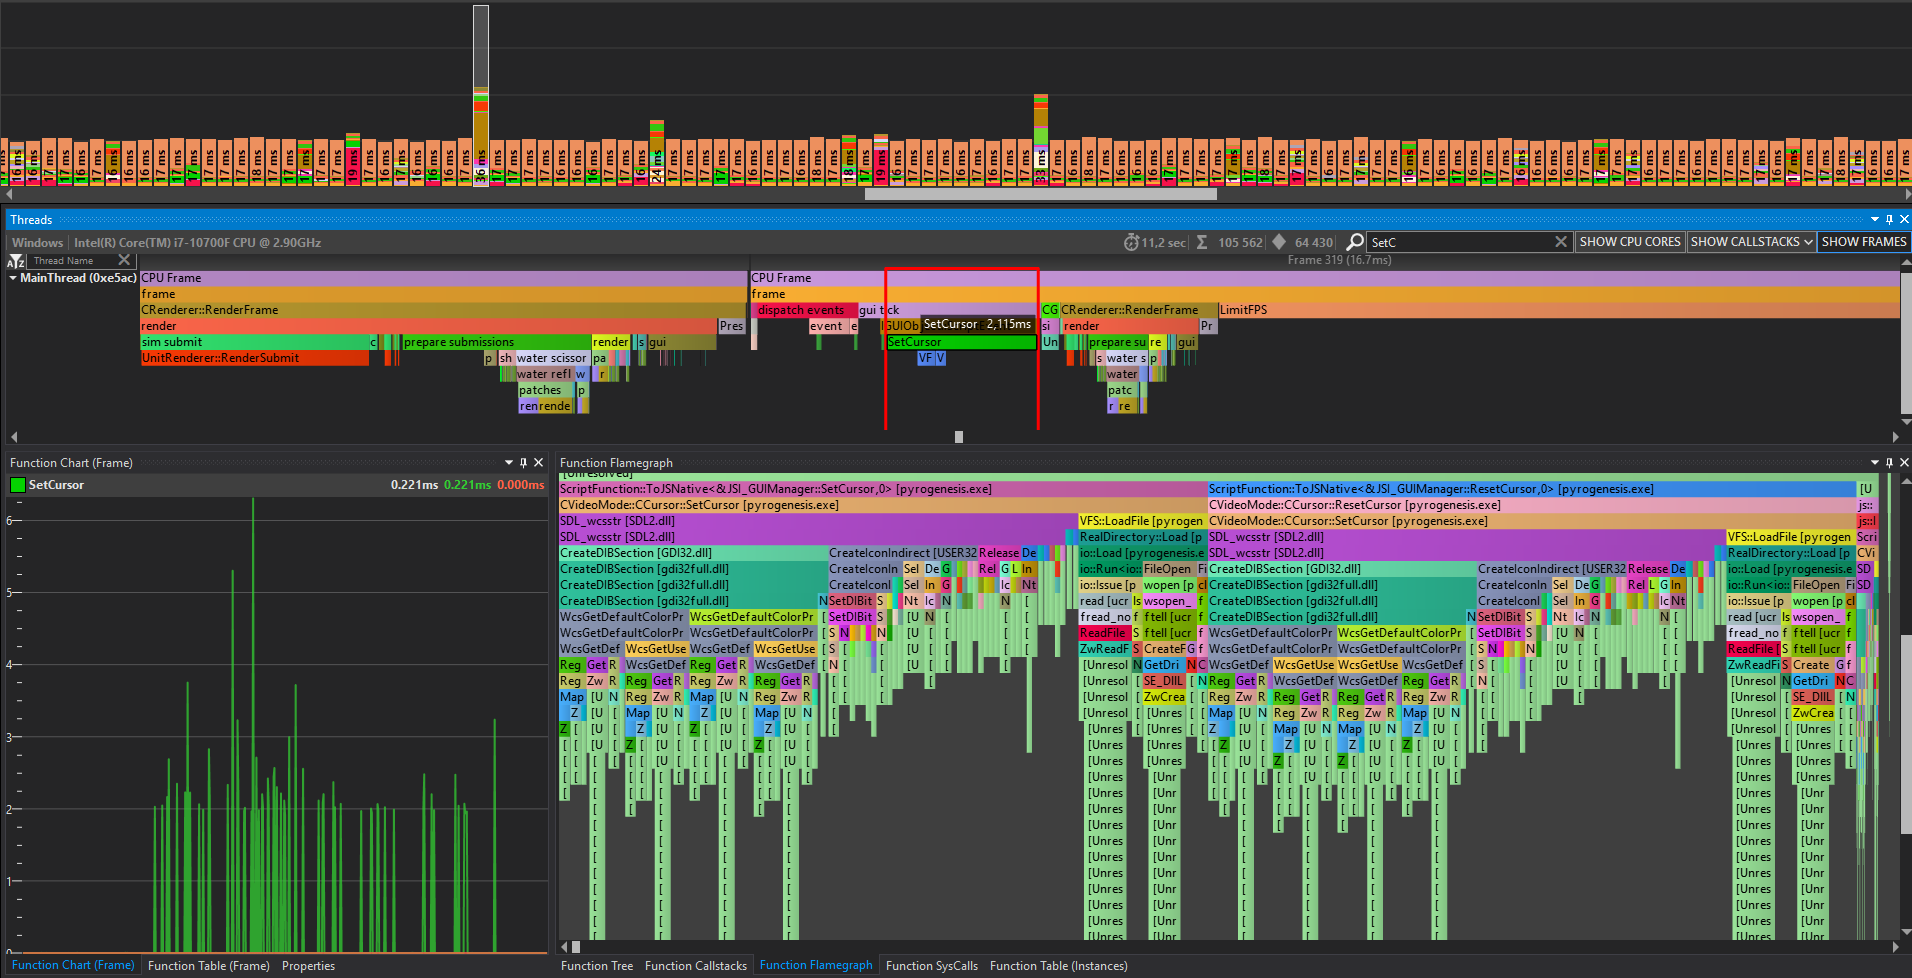
In the capture above you can see the per frame time at the top, then the timeline of each frame in the middle and finally the flame graph under the selected element at the bottom right. As we explained before the instrumented tags come from what I added to the codebase3, while the sampling tags are extracted from the stack trace and the debug symbols, giving us an insight into which low level Windows APIs are being used (and in our case, taking way too much frame time).
That way we get the best of both worlds. The instrumented flame chart gives us an easy way to spot outliers and most commonly offending parts, while sampling gives us an immediate measured breakdown without needing to add more instrumentation scopes (and recompiling).
Getting started
The first question is: are you using a big game engine like Unity or Unreal? If so, there’s already something there for you.
Unreal
In Unreal 5 it’s called Unreal Insights and it’s already full of information even if you use it out of the box. Every engine thread is already registered, most important engine functions already have profiling scopes, as well as the entry point of each blueprint and the tick function of every AActor in your game. That should be enough as a starting point to give you a rough picture of what’s happening in your tick.
But of course, you will want to add your own. Especially if you implement custom ticking objects that do a lot of work and could use a breakdown under the basic FTickableGameObject.
#include "ProfilingDebugging/CpuProfilerTrace.h"

struct CustomManager : FTickableGameObject
{
    TStatId GetStatId() const override
    {
        // Tickables don't have a nice label by default
        // Override to supply one
        RETURN_QUICK_DECLARE_CYCLE_STAT(CustomManager, STATGROUP_Tickables);
    }

    // Already scoped with the label given by GetStatId, but children aren't
    void Tick(float DeltaTime) override
    {
        Foo();
        Bar();
        Bazz();
    }

    void Foo()
    {
        TRACE_CPUPROFILER_EVENT_SCOPE_STR("Foo");
        // ...
    }

    void Bar()
    {
        TRACE_CPUPROFILER_EVENT_SCOPE_STR("Bar");
        // ...
    }

    // And so on...
} ;
Unity
Similar to Unreal, Unity will add tags that will appear in the Unity Profiler for engine side operations, MonoBehaviour updates, coroutines, Entities systems and GC allocs.
That’s already quite a bit, but like with Unreal when turning MonoBehaviour into a manager class with complex Update() it usually doesn’t tell enough to give the full picture.
There is, of course, an API to add your own profiler markers:
using Unity.Profiling;

public class CustomManager : MonoBehaviour
{
    // Profiler marker are expensive to create, cache them in the class
    static readonly ProfilerMarker s_FooPerfMarker = new ProfilerMarker("Foo");
    static readonly ProfilerMarker s_BarPerfMarker = new ProfilerMarker(ProfilerCategory.Ai,
                                                                        "Bar");

    public void Update()
    {
        Foo();
        Bar();
        Bazz();
    }

    private void Foo()
    {
        s_FooPerfMarker.Begin();
        // ...
        s_FooPerfMarker.End();
    }

    private void Bar()
    {
        // RAII-ish alternative
        using (s_BarPerfMarker.Auto())
        {
            // ...
        }
    }
}
Custom engines
On custom engines, you will have to rely on a 3rd party profiler. I will use Optick for the rest of this section but others are very similar. I still prefer it in my personal projects despite the fact that the project seems abandoned (the github has no activity in a few years and the owner hasn’t meaningfully replied to my solicitations). If I get more spare time I might just fork it and add my own fixes and contributions…
Since we are starting from scratch we first need to define what is our main thread and loop. In games (and other interactive applications) that is usually the main loop that drives input handling and presentation. On a daemon app that could be the main request processor.
On a fully parallel server app with multiple threads servicing requests from a queue the concept of “main” thread becomes a bit pointless and at this point we’re only picking one to satisfy the profiler’s need to display per-frame timings at the top. I’d probably pick the loop that calls epoll_wait() or select().
#include <optick.h>

int main()
{
    // Init app
    App app;
    // Run
    while (!app.exit_requested())
    {
        OPTICK_FRAME("Main thread");
        app.poll_events();
        app.update();
        app.render();
    }
    return 0;
}
That gives us enough for the profiler to hook up to our application and show our frame time, but not much more. Now we should populate it with some actual markers:
void app::update()
{
    // With no argument it will use the qualified function name as label
    OPTICK_EVENT();
    // ...
}

void app::render()
{
    // If we don't like it we can also add custom labels
    OPTICK_EVENT("render");
}

void app::poll_events()
{
    Event event;
		while ( PollEvent( &event ) )
    {
        // Dynamic label (performance sensitive, see next paragraph)
        OPTICK_EVENT_DYNAMIC(enum_to_string(event.type));
        // ...
    }
}
This way we get a breakdown of application’s basic flow. But as mentioned in the comment there’s a catch: we use dynamic event labels and those are expensive because they usually involve a runtime lookup in a hash table. This isn’t limited to Optick, we saw earlier than Unity for example has the same recommendation to pre-build labels.
This can be mitigated by generating events once in a static variable (like we did with Unity’s ProfilerMarker). This is slightly complicated by the fact that Optick markers also carry source location alongside labels, so the static maker must be constructed from the usage site. This is all manageable through some helper structs and macros, and with C++26 we can even generate labels for each enum with reflection to populate a static array of Optick::EventDescription*. But this is getting a bit complex for an introduction to instrument profiling so I’ll leave it for another post.
Now one last thing to add is thread registration, which is done by calling OPTICK_THREAD() somewhere in the run() routine of your workers:
void thread_worker::run()
{
    OPTICK_THREAD("Worker thread");
    while (!stop_requested())
    {
        if (const auto task = scheduler.pop_task())
        {
            // Or preferably a static OPTICK_EVENT() in the body of the task implementation
            OPTICK_EVENT_DYNAMIC(task->name());
            task->run();
        }
        else
        {
            scheduler.sleep();
        }
    }
}
Recycling
In my experience a lot of existing projects already have some form or another of profile scopes. They often come in the form of timings inside the application itself.
For example, when I looked into open source game 0 A.D. I found out that they already had a PROFILE2_EVENT() macro. So all I had to do was to tweak it by adding an extra bit:
#define PROFILE2_EVENT(name) g_Profiler2.RecordEvent(name); \
                             OPTICK_EVENT(name)
And voilà! With that macro tweak alone I could immediately see anything the team had considered important to scope in the past.
Ideally you would wrap OPTICK_EVENT() and friends behind a macro that expands to nothing on live builds, and do the same with every extra you had (like the utilities to generate static labels for dynamic branches we mentioned above). Even better, this then allows your main profiler scope macro to wrap several profiler instrument markers depending on platforms or user preference4.
To scope or not to scope
A question I often get when I introduce people to profiler instrumentation markers is “where should I add more scopes”. The answer usually comes with use, trying to profile the application will sometime run into blind spots where no marker accounts for the time spent. This is an excellent occasion to add some. As more time is spent using instrumentation profiler more markers should naturally appear.
But if you are starting from scratch we can devise a cheat sheet based on what game engines with embedded profilers already provide:
- Systems and actors
Tick()andUpdate()functions - Blocking I/O (
open,read, …) - In general any
wait()orsleep()functions that isn’t a worker thread waiting on empty work queue - Since they can’t directly be modified, external library calls that will invoke synchronized waits (like
std::future::get()) should also be enclosed in a profiler scope - Functors and lambdas that are passed to a task system (like the body of
tbb::parallel_for()) - With couroutines, be careful to not have scopes that cross any
co_awaitorco_yieldboundary unless you have special code in yoursuspend()andresume()to handle any dangling scope - Any operation that is known to take some non trivial amount of time in your domain (for example: compiling a shader, loading a mesh or material, loading a scene or level, making a savegame)
- Any function over a certain CPU time threshold (somewhere between 10-100μs for a realtime application is a good baseline)
I have not personally gone as far as to add a marker for malloc(), but since Unity does it for managed allocations, that wouldn’t be entirely unheard of. The only real limit is how many scopes per frame a profiler can handle (Optick has trouble when captures go over 1GB, others can handle more).
What next?
Once you have added profiler markers to your project, I guarantee it will improve its performance in the long run. Because as long as there’s a tool you can quickly connect to any development build to have a rapid look at the flame chart, you will see something that doesn’t feel quite right and find venues to improve things.
The next step is to get the rest of your team to embrace it too, which is usually easy enough once there’s a minimum skeleton in place. Give it a shot!
1: In my experience the ones built for sampling first are better at it but have poor UX when it comes to instrumentation. The worst being Apple Instruments, which despite its name is absolutely horrible at instrumentation profiling.
2: A flame chart uses an absolute timeline for the X axis, while a flame graph uses aggregated time (% of total) for the X axis.
3: Actually most of those scopes were recycled from existing code, as explained later in the article.
4: I could never convince my entire team to decide between Optick and Tracy, so we supported both.